EVALUATION OF
ENVIRONMENTAL SOUND IN THE COMMUNITY
By Noral D. Stewart, Ph.D. FASA FASTM
Revision of July 23, 2011
(copyright 2011)
There are ancient references to noise being a problem in cities. In this century, noise was recognized as a problem in cities in the 1920's. The sources were new modes of transportation, ventilation systems, industrial plants, and loudspeakers. The coming of jet aircraft renewed interest in environmental noise. With increasing population density, communities become noisier.
There has been much research on problems related to noise in the community. Most of this has concentrated on sources related to transportation, military systems, and ventilation systems. That is because these sources are widespread, and there are readily available mechanisms to fund the research. Most of this research has concentrated on establishing acceptable quantities of sound and reducing sound to those levels for these common sources. However, most of the research has concentrated on densely populated areas where more noise is expected. Many of the criteria developed are aimed primarily at evaluating whether certain land uses such as residential can be made compatible with a given level of noise. This is a different matter than evaluating whether new noise is compatible with existing development. Some criteria based on long-term averages also fail to recognize problems due to recurring loud events that may only occur once a week.
Problems due to the amount of sound from a fixed source are usually solvable with enough money. The producer of the sound usually does not need or want the sound any more than neighbors who might be complaining. Primary exceptions where it is most difficult are sources involving outdoor entertainment or recreation.
More recently, manufacturers of many products such as automobiles, appliances, and ventilation systems have been paying more attention to "Sound Quality." They have realized that once the quantity of sound is reduced, the quality becomes important. People have an expectation for way sources should sound. In quieter communities, this expected sound quality also becomes important. People expect to hear a blend of sounds that become unnoticeable. Sounds that stand out and typically demand attention cause problems if they are heard clearly regardless of the level of sound. It is important to consider both the amount of sound and the way it sounds. Problems due to the nature of a sound are sometimes related to industrial machinery that might have an impulsive character or sound like a siren. The more difficult problems to resolve are those related to speech, music, or other recreational activities where the sound is desired by the producers or their customers.
This document has evolved from work on several projects. Portions of this material have been and often are incorporated into reports on major projects. It is intended to provide a basic primer on noise in the community.
Environmental Sound and its Measurement
Sound
The human ear is a remarkable mechanism. It can sense and give meaning to a wide range of sounds varying in loudness and pitch. Perception is not directly related to the physics of sound.
The effect perceived by the ear as sound is a very small and rapid change in air pressure. The variations are very slightly above and below the barometric pressure. The perceived loudness of a sound corresponds primarily to the size of this variation in pressure. The ear is very sensitive and can detect, at some frequencies, variations less than 3 billionths of a pound per square inch (psi). Variations greater than 0.001-.01 psi can cause pain or discomfort. Notice that the pressure variation of the loudest sounds we hear is about a million times that of the quietest sounds. The energy in the sound is actually related to the square of the pressure. Thus, the energy in very loud sounds can be a million-million times that in a very faint sound.
For humans to hear the sound, these air pressure variations must be rapid. They must complete a cycle at least 20 times per second and not more than 20,000 times per second. The repetition rate of these cycles is called the frequency of the sound. It has units of Hertz (Hz) where one Hz corresponds to one cycle per second. The bass sounds in music are low-frequency, and the treble sounds are high-frequency.
Because of the wide range of sound pressures encountered, a special scale, the decibel scale, has been developed. The sound level increases by 3 dB (or decibels) when the actual sound energy present is doubled. Conversely, half the sound energy must be eliminated to reduce the level 3 dB. A six decibel change indicates four times as much sound, and a 10 decibel change 10 times the sound. However, the ear does not perceive these changes to be so large. Most people find a 3 dB change barely noticeable. A 6 dB change is clearly noticeable, and a 10 dB change is perceived as a doubling or halving of loudness. This is very important. It means that 90% of a given sound energy must be eliminated before most people will judge a sound half as loud.
People do not hear very low-frequency and high-frequency sounds as well as they hear sounds in the middle speech frequencies. A special electronic filter is used in sound meters to simulate this characteristic of the ear. For many environmental sounds it gives a simple, single-number descriptive level that correlates with the way people judge the loudness of the sound. This measure is called the A-weighted sound level. The units are usually written dBA or dB(A).
Outdoor Sound Propagation
In the simplest idealized model, the sound level outdoors decreases 6 decibels for each doubling of distance from the source. The farther one is from a sound source, the farther away one must go to notice a significant decrease in sound level. In the real world, the sound level often decreases more rapidly with distance. This is due to barriers blocking the line of sight, absorption by the air, winds, and temperature variations in the atmosphere. The atmospheric effects become most important at distances beyond about 1000 feet from the source. Dry air absorbs sound and reduces its level rapidly over distance. The normally humid environment in the southeastern US allows sound to travel further with less reduction in level. Downwind and under many night-time conditions (cooler air near the surface), sound waves that start upward will bend downward. Thus, the noise reduction benefits of barriers can be negated by these atmospheric effects. Levels will be lower upwind and under most daytime conditions. Sound waves curve upward in the face of a wind or towards cooler air higher in the atmosphere. For the same sound output at the source, distant levels can be over 20 decibels less than predicted by the distance effects alone.
Sound Measurement
The basic instrument for sound measurement is the sound level meter. This is a microphone connected to a voltmeter with some additional features. The microphone produces an electrical voltage signal proportional to the sound pressure variation, and the voltmeter is calibrated to read the sound level in decibels. Most meters have "fast" and "slow" responses. These are effectively moving averages of the sound level. The fast response corresponds more closely to the actual fluctuating sound heard, with the needle sometimes moving very quickly or digital display changing rapidly. However, the slow response provides a slowly changing indication that is easier to read. It averages the sound over about a second, and commonly used for environmental sound measurements. The fast and slow response both introduce some averaging into the measured result. Some meters have a special "impulse" response that is used primarily in Europe. When a sound occurs very rapidly, such as a gunshot, it is sometimes desirable to measure the peak pressure without any averaging. This is called the "peak" level. It can be much higher than the maximum level that might be measured with either the fast, slow, or impulse response.
It is often useful to know the level of the sound at different frequencies over the audible range. An octave-band analyzer is most commonly used for this. It divides the audible frequency range into octave bands (similar to musical octaves) so sound energy in each band can be measured. These bands are identified by the center frequency of each band. The center frequency doubles for each higher frequency band. Octave-band measurements can be A-weighted for a better indication of the contribution of each octave to the A-weighted level. However, they are not normally A-weighted if used for comparison with criteria based upon unweighted data. For diagnosing the source of sound, a finer resolution of frequencies is often desired. The octaves are often broken into one-third-octave bands. A finer resolution is provided by a Fast-Fourier-Transform analysis of the sound. This can provide a resolution of one Hertz or less that can be related to a specific characteristic of a source.
When measuring typical fluctuating environmental sounds over long periods, it is common to use average and statistical measures. One cannot simply write down several measured sound levels and arithmetically average the values. The energy average of 60 dB and 40 dB will be approximately 57 dB, half the higher 60 dB level. The energy equivalent average level over a given time is called the "time-average sound level." It is also often called the "equivalent level," abbreviated LEQ. The averaging of sound levels can be complicated unless one has a special instrument that does it automatically. Average levels over a period due to individual events can be calculated by combining the "sound exposure level" (SEL) of the events. The SEL is a measure of the sound energy of the event. It is the level in decibels of a sound of the same energy lasting exactly one second.
The sound level during a given period also can be characterized by the level exceeded a given percentage of the measurement period. For example, the level exceeded 90% of the time is defined as the L90 value. It is a good indicator of the background sound level. The L50 indicates the level exceeded half the time, usually a little less than the time-average sound level. The higher sound levels are indicated by the levels exceeded a small percentage of the time. Many local noise ordinances developed before the widespread availability of averaging meters were based on the L10. The L10 is usually a few decibels more than the time-average sound level for varying sounds. The L10 can be less than the time-average sound level if a very loud sound occurs less than 10% of the time. L01 indicates the highest levels likely to occur. The difference between L01 and L90 or L10 and L90 is a good indicator of variation in sound levels. A measurement period always must be specified for any statistical values such as L01, L10 or L90 to have meaning. The number of samples measured should be at least 10 times the difference in decibels between the highest and lowest level. Otherwise, different people measuring the same sound could get widely varying results. Ideally, with automated instruments there should be at least two samples per second with slow meter response, and at least 16 samples per second with fast response. This gives a complete description of the sound variation.
A special type of average sound level is used to describe the long-term acoustical climate of a location. The Day-Night Average Level is typically calculated over a year, and has a 10 dBA night-time penalty added to all sound between 10:00 p.m. and 7:00 a.m. This is abbreviated DNL, or sometimes LDN. DNL is most useful for planning purposes when noise does not change much from day to day. It fails to identify some problems due to intermittent loud periods our undesirable sound qualities. Most typically, daytime average levels are close to or a few decibels less than the day-night level. Night-time average levels are usually 5 to 15 dB less than the day-night level. If the noise is dominated by a major highway, the DNL is usually within one dB of the average level for the loudest hour. As with any average, communities with very different actual noise characteristics can have the same day-night level.
Typical Community Sound Levels
Our world is filled with sound. People in various places have become accustomed to a wide range of sound levels with widely varying frequency and temporal characteristics. We usually do not even notice these background sounds. We may notice but accept certain identifiable sounds such as properly muffled automobiles or lawn mowers. Problems occur when loud sounds regularly interfere with activities. There also can be annoyance when the frequency content, time pattern, information content, or concentration of sound from a given direction makes it especially noticeable. When the sound is undesirable, we call it noise. Noise is by definition undesired sound. Depending on circumstances, one person's music may be another's noise. Even the same sound may be music or noise to the same person at different times.
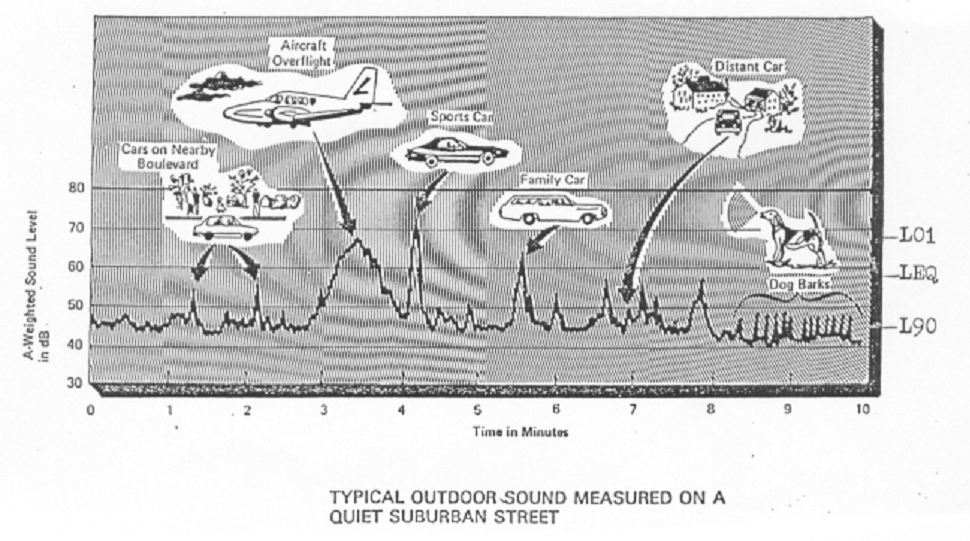
The figure at the top of this page shows ten minutes of sound measured for the US EPA on what is described as a "quiet suburban street." However, many southeastern US areas would consider this an urban area by local standards. It represents an area of single-family homes with lawns around them. While the level much of the time is below 50 dBA, it sometimes rises above 60 dBA. The average level, LEQ, for this period is around 58 dBA. Many people have a tendency to consider only the quietest background sounds as the typical sound of their community. This is not realistic. A common occurrence often overlooked is high-pitched insect sound in the range of 55 to 60 dBA. The average level often provides a better indicator of the sound. However, you must be careful. The average level can be raised very much by a single, short, very loud sound. Thus, average levels also may not represent conditions normally expected. Knowing the full statistical picture of the sound is helpful. The L90 indicates the background level, around 44 dBA in the figure, and the L01 indicates the loudest levels, around 68 dBA in the figure.
While no perfect measure has been developed, the day-night level is the best available single- number rating for the long term acoustical "climate" of a community. The range of day-night levels in American residential communities is wide. In some wilderness and farm areas it can be below 35 dBA. However, it is often closer to 45 dBA due to insects, animals, and farm activities. Most residential areas are in the range of 50 to 60 dBA. The day-night level can be as high as 85 dBA at some places in very densely populated parts of large cities.
The EPA published data in 1974 relating typical day-night sound levels to population density. The data also showed the percentage of the national urban population exposed to the various levels. The table below is a listing of this data extended to rural areas. Some places can be noisier than expected based on the population density alone. This can easily happen around airports and near major highways. For population densities of 6300 people per square mile and higher, there is usually very little provision for outdoor activities. People in these more populous areas are more likely to live mostly indoors. They use protected local parks or travel to recreational areas in the country for outdoor activities. In quieter, low-density areas there are single-family homes with large yards. People expect to enjoy outdoor activities in their own yards. Thus, there is a difference between "indoor communities" that accept more noise and "outdoor communities."
Relationship of Population Density to Sound Level (based on 1970 census)
Day-Night Level, dBA % of US Population People per square mile (acre)
35-50 33 Non Urban
45 9 200 (0.3) very light density
50 8 630 (1) light suburban
55 14 2000 (3) small city, suburban
60 19 6300 (10) urban multifamily
65 13 20000 (30) dense urban
70 5 63000 (100) very dense urban
The population density of southeastern US neighborhoods is usually less than that for the neighborhoods of a large portion of the people in the United States though these differences are decreasing and may not exist everywhere. In North Carolina in particular the population historically lived primarily in the country and small towns and annexation laws allowed cities to spread out with low density. Consider some differences in statistics between the US as whole and North Carolina for illustration. Among cities of greater than 100,000 people, nationally the mean population density is 4130 people per square mile and the median is 3160. For the nine North Carolina cities in this category, the mean is 2200 and the median 2400. North Carolina and especially its two largest cities and counties have been growing rapidly in recent years. North Carolina is now the 10th largest state in population. Forty percent of the population of the country is concentrated in 90 counties and independent cities. In 1980, none of these were in North Carolina. In 2010, Mecklenburg County is number 49 and Wake County is number 56 in population. These counties are now each approximately 9.5% of the state population. In 1980, the largest city in each state averaged 13.6% of the state population, and in NC the four largest cities combined totaled only 13.1% of the population. In 2010, the largest city in each state averages 11.7% of the population, but the two largest NC cities total to 11.9% of the NC population. Charlotte is now the 17th largest city in the US, though Rand McNally does not consider it to be among the 30 “national” business centers. While the population of this state is spread out with a low density, there are some places where sound levels are higher than expected. These include areas around airports and near major highways. However, the population density is a significant factor in considering appropriate noise criteria for evaluating a community. Some criteria that have been developed to evaluate noise in densely populated areas are appropriate for the lifestyle and expectations in those areas. They are not necessarily appropriate for the southeastern environment and lifestyle.
Effects of Noise
The scientific community has documented many effects of noise on people and their activities. Some are directly related to the noise. Others are related indirectly as a result of stress induced by the noise. The United States EPA has recognized clear evidence that noise of sufficient intensity and duration can Temporarily or permanently damage hearing,
Affect performance of a complicated task,
Interfere with speech and other auditory communication,
Disturb sleep, and
Be a source of annoyance.
These effects could be expected to affect the value of noise-impacted property. Studies based on aircraft noise have indicated a value reduction of .5 to 2.5% per decibel increase in average sound level for residential properties.
The level and duration of noise required for hearing damage is greater than that required for other effects. Hearing loss is rarely an issue in residential areas. Hearing losses typically occur from work or recreational exposure to loud sounds.
High sound levels cause a person at work to concentrate their attention to their most important task. This improves performance on simple tasks, but deteriorates it in more complicated cases where several tasks are done at once. Most of the research in this area has been done for sound levels over 70 dBA which occur infrequently in residential areas.
Communications interference, sleep interference, and general annoyance effects are well documented noise problems in communities. These effects, especially annoyance, occur for a wide range of sounds varying in level, frequency and temporal characteristics. Non-acoustical factors also strongly influence annoyance. Stress induced by annoyance can affect the ability of the body to fight existing ailments. Annoyance, and interferences with communication and sleep are discussed in more detail below.
Communications Interference
Most people at one time or another have experienced communication difficulty as a result of background noise levels. The degree of interference depends on many factors. These include the level and steadiness of the interfering noise, (particularly the level of the noise at speech frequencies), the listener's prior knowledge or anticipation of part of the transmitted information, and the sound level of the transmitted information. The sound level of the transmitted information at the listener depends on the distance between the source and the listener. For a speaker and listener outdoors, around 6 feet apart, the beginning of speech interference by many common steady noises is at around 60 dBA.
Sleep Interference
Sleep interference is a consistent and prevalent complaint in surveys taken about community noise problems. Research reviews clearly show noise interferes with sleep either by awakening the sleeper, by altering the depth of the sleep, or by making it difficult to go to sleep. Older people are more likely to be awakened, but are less affected by the loss of sleep.
However, a complicating factor in research is that meaningfulness of the noise has an effect on whether or not a person is awakened. For instance, the cry of a baby may awaken a concerned mother but not others. Undesired sound including information such as speech or music is difficult to ignore when one is trying to go to sleep. A developed attitude about a noise also influences ability to go to sleep. A person upset by sound from a neighbor's air conditioner may have difficulty going to sleep. However, the same person may have no problem with a very similar sound from his own ventilation system at other times.
There is widespread consensus that steady sound levels in bedrooms should be below 35 dBA when possible but that levels up to 45 dBA can be preferable in environments where louder intermittent noise events are present. Laboratory studies indicate key factors are to prevent changes of 10 decibels or more in sound level, or intermittent sounds over about 55 dBA. However, field studies with aircraft noise indicate people in their homes may be awakened by about 2% of events when exposed to events reaching a maximum level around 55 dBA.
Community Reaction and Annoyance
The adverse responses of people to noises introduced into their environment are measured in two ways. These are counting complaints to authorities or "community reaction," and by surveys that rate "annoyance." The number of complaining people does not directly indicate annoyance. Some people who are annoyed do not complain. One study examined the relationship between the number of people "highly annoyed" and the number who complained. The researchers found that if 1% complained, 17% were highly annoyed, and if 10% complained, 43% were highly annoyed. A few complaints may show a high community-annoyance level.
As a result of various research studies, several important factors were identified for determining the community reaction and annoyance produced by noise. These were identified by the US EPA as follows.
Level and frequency content of the noise.
Duration of the noise.
Time of day noise occurs.
Time of year the noise occurs.
History of prior exposure to the noise source.
Perceived attitude of the noise source owner.
Special characteristics of the noise that make it especially irritating.
Outdoor sound level when offending noise is not present.
People are more accepting of noises that occur only in daytime or only in winter. They accept noises they are accustomed to and were present when they bought their property. It helps if they believe the producer of the noise is doing everything reasonable to control it. It also helps if the noise is not unpleasant sounding.
An important factor is whether the noise is much louder than the sound present in the neighborhood without the noise. The most significant result of the EPA community reaction studies is that widespread complaints and possibly legal action usually occur when the average level of noise from a single source is regularly more than 5 dB above the average level of other sounds in the community. Vigorous community action results for differences of 20 dB.
Perceptions are important. The attitude of the source owner as perceived by the complainant is often the second most important factor. Sometimes complainants have a misconception of the true attitude of the source owner. Other studies have identified other perception factors that are very much related to community reaction and annoyance. These include whether the complainant perceives the noise as
Unnecessary or unnecessarily loud,
A threat to personal health or safety,
A threat to economic investment (property value), or
Beyond his control, or if
The complainant believes he is being ignored or treated unfairly.
Special characteristics in the way the noise sounds must be considered. Some sounds are more irritating or difficult to ignore than others. The acoustical designers of vehicles, appliances, and other products today spend most of their effort on "sound quality." It is recognized that people not only expect quiet, but expect a quality of sound. The most common sounds with irritating characteristics are those containing tones, or repetitive impulses, or information content. A tone is a concentration of noise at a single frequency. Examples of sounds with strong tones are sirens, horns, bells, whistles, and certain types of transformers, pumps, and fans. These produce shrill, whining, or humming sounds which get attention. These are the types of sound that are helpful as warning devices, but are irritating to listen to continuously. A repetitive impulsive sound is one which is made up of repeated pulses of sound. Examples are power presses, hammering sounds, and gunshots. Such sounds usually must be several decibels quieter in measured sound level than "normal" sounds to produce a similar amount of annoyance. A five decibel penalty has often been used. However, recent research indicates that highly impulsive sound such as gunshots must produce a time-average level 12 dB less than more common sounds for the same annoyance. Loud or amplified speech and music pose difficult problems because of the information content. People do not expect to regularly recognize music or understand speech coming from outside their home. Quantity of sound is the major issue in densely populated areas. However, the quality of sound is usually the stronger issue in less densely populated areas.
Evaluation of Environmental Sound
The normal goal in environmental noise evaluation and control is to assure compatibility between the noise in a community and the needs and expectations of residents and business owners. The federal government and national standards organizations provide some guidance. The federal government regulates all transportation noise sources. However, local governments are responsible for any regulation of local noise sources not on public roads or in the sky. Such local regulations are usually minimal. They strive only to prevent the worst of problems. Regulatory compliance does not necessarily relieve a noise producer of responsibility if the value of property impacted by the noise is reduced.
The following discusses first the general way acoustical consultants view the problem of acoustical compatibility. There is then some specific discussion of national standards and federal guidelines. Finally, local ordinances related to noise in residential areas are discussed, emphasizing those in North Carolina.
Acoustical Compatibility in Site Selection and Design
Acoustical consultants are sometimes asked to assist planners and developers in selecting sites for various facilities and in facility design. The first goal is to find a site that is as compatible acoustically with the intended usage as possible. This then reduces the cost of design to maintain compatibility. The goal may be to find a quiet location to minimize construction cost to block noise. You would not want to place a concert hall directly in the take-off pattern of an airport. When the new usage produces sound that will be difficult to control, the goal is to find a location where the sound is not a problem. This may mean large buffer spaces between sources and nearby sensitive areas. The cost of sound control is balanced against that of providing a buffer.
Residential areas are often portrayed as especially sensitive to noise. Many communities limit noise going into residential areas by ordinance, and some prohibit new residential development in especially noisy areas. In reality, the existing conditions and expectations in residential communities vary widely. In some communities a major asset is their peace and quiet. Such communities may be remote from city conveniences and major travel arteries. Such areas often attract people willing to sacrifice some convenience for the quiet. In more densely populated urban areas, the primary noise concern is inside the home. People expect it to be noisy outdoors. They accept that as long as the sound penetrating the home is acceptable.
It is widely recognized that attitudes regarding noise vary from person to person. Actually the tolerance of a given person can vary from time to time. A young person might accept a noisier neighborhood they can afford and that is convenient to their work or school. If they like to party, they may prefer a community that will accept their late-night sounds. They may prefer a neighborhood with late-night entertainment even if it is loud. Later in life, they may prefer a quieter place. Once they find a quiet place in the country, they may not tolerate the same sounds they once participated in producing. Many people live in major cities but have weekend retreats. They tolerate much more noise in the city than they would tolerate at their weekend place. People also will accept infrequent special events much more readily than regularly recurring events. A loud event once or twice a year is usually not a problem if beneficial to the community and well publicized. Weekly events occurring every Friday or Saturday evening are common problems.
Many factors must be considered when evaluating compatibility between a new sound source and a community. The first is compliance with any applicable regulations. This may not be sufficient. Most regulations are only minimally protective. Neighborhood characteristics and expectations must be considered. Usually a sound source will affect a limited area with similar characteristics. Sources affecting large areas may affect several neighborhoods with different characteristics. It may then be possible to direct the sound into areas where it is better accepted. Other sound-control measures are then considered. Setting an appropriate goal requires judgment and experience. Most communities will accept some new sound. If the goal is set too low, it results in extra cost for the owner of the source. It could jeopardize whether a project can be built. However, developers are cautioned against setting a high initial goal and expecting to reduce the noise if problems develop. Once a problem is perceived, it often takes more noise reduction to satisfy neighbors.
Federal Guidelines and Regulations
Most Federal noise guidelines and regulations for residential areas are based on the day-night average sound level (DNL). However, they are inconsistent with some allowing much more noise than generally considered desirable. These higher limits used by some agencies were set in the 1970's based on acceptance by people who had chosen to live in such areas and by the difficulty of the agency to meet lower noise levels. This is very misleading when new or increased noise is imposed on communities initially developed with an expectation of lower noise. The existing population may have chosen to live in an area because of its quiet. That would more likely be the case if the area is developed to appeal to people seeking a quiet environment.
The U.S. Environmental Protection Agency in 1974 recommended that DNL should be kept below 55 dBA in residential areas "to protect public health and welfare with an adequate margin of safety." This level corresponds to that normally present in a community of about 2000 people per square mile. This study, commonly called the "Levels Document," provided tables to help evaluate problems and potential for noise complaints based on DNL. These tables were based mostly on experiences in densely populated urban areas. It was recognized that the measured DNL in some cases would have to be adjusted or "normalized" before comparing to criteria to achieve an accurate assessment. For instance, it was recommended that 10 dB be added to the measured DNL in a "quiet suburban or rural community (remote from large cities and from industrial activity and trucking.)" Unfortunately, some of the most widely applicable Federal guidelines and regulations fail to recognize this need to tailor the criteria to the circumstances.
The U.S. Department of Housing and Urban Affairs (HUD) has noise criteria to evaluate whether it will fund housing in an area. HUD drew upon a study by Ted Schultz relating the percentage of people highly annoyed by noise to the DNL where they lived. HUD recognized it desirable to set the limit at DNL 60 dBA, corresponding to noise expected in an area with a population density of about 6000 people per square mile. However, HUD needed to build housing in more densely populated and noisier locations. Due to economic considerations, the limit was set at a DNL of 65 dBA. This corresponds to a level normally expected in an area of 20,000 people per square mile. Levels above DNL 65 dBA are considered “normally unacceptable” by HUD, but housing is allowed with steps to reduce interior noise and noise in designated outdoor recreational areas. Areas with DNL 60 to 65 dBA are considered “normally acceptable,” and those under DNL 60 dBA are “clearly acceptable.” Areas with DNL greater than 75 are “unacceptable.”
The Federal Aviation Administration and the Department of Defense have adopted DNL 65 as their goal and the level above which they will fund noise control efforts. They do not recognize noise impacts from aircraft or military activities below this. The Federal Highway Administration criterion for funding noise barriers is a loudest hour average level approaching or exceeding 67 dBA. This is comparable to a DNL of 66-68 dBA in most cases. Funding can be provided in some cases for very major noise increases that do not reach this level.
Contrasted to these are the criteria used to evaluated railroad noise by the Federal Transit Administration, the Federal Railway Administration, and the Surface Transportation Board. They consider a project noise of DNL 55.5 dBA to be an impact on an area with an existing DNL of 55 dBA. A project with DNL of 62 dBA is considered a severe impact in such an area. In very quiet areas, transit projects with DNL 55 dBA or less can be considered a severe impact. The American Public Transit Association also has a further criteria based on maximum level during a passby, ranging from 70 dBA for single family homes in low-density quiet areas to 80 dBA for multifamily areas in already noisy high-density areas.
The Federal Energy Regulatory Commission regulates the noise of pipeline compression stations and requires that they not exceed DNL 55 dBA at any pre-existing residential location.
National Standard
The use of DNL for land-use planning has been standardized in a national standard, ANSI S12.9 Part 5 Sound Level Descriptors for Determination of Compatible Land Use. Note that this is for planning the use of land with an existing noise exposure, rather than for evaluating impact of a new noise on existing development. An appendix to this standard (which is not strictly a part of the standard) gives examples of compatible day-night levels for various land uses. It indicates that single-family homes with extensive outdoor use are compatible with day-night levels of 55 dBA and less, and marginally compatible in the range of 55 to 65 dBA.
International Guidelines
The World Health Organization (WHO)has guidelines indicating that “serious annoyance” should be expected in residential areas if the average sound level exceeds 55 dBA in the daytime or 45 dBA at night, with “moderate annoyance” for levels 5 dB lower. The WHO also suggests a limit of 60 dBA on the maximum event level at night to protect from sleep disruption.
The World Bank Group has guidelines to insure that their projects in developing countries do not create problems. They require that financed industrial projects not exceed average levels of 55 dBA in the daytime and 45 dBA at night at residential locations. These recommendations are supported by the International Organization for Economic Co-operation and Development, which further recommends levels 5 dB lower in rural areas.
Local Noise Ordinances
Many local noise ordinances are only subjective, prohibiting “loud” or “unnecessary” sounds. These can be very difficult to interpret and enforce and are sometimes held to be unconstitutional. Sometimes specific activities known to often be a problem are prohibited. This can be unreasonable if someone is prepared to take steps necessary to limit the sound from such activities.
Chicago, around 1955, adopted the first known local noise ordinance containing specific measured noise limits. It followed an extensive survey of existing city sounds. These were zoning regulations aimed primarily at industry. Initially, they applied to steady sounds only and were the same day and night. Though the regulation called these “maximum” sound levels, the interpretation of “sound level” at the time was an eyeball average of the meter reading, not the instantaneous reading. The limits were expressed in octave-bands, and within a few years the standards defining the frequency limits of octaves were changed. The equivalent A-weighted levels were 61 dBA for sound entering other business areas, and 54 dBA for sound entering residential areas. The survey showed that only one percent of the industry in the city would need to make changes to meet the limits.
Many communities have adopted local ordinances for controlling noise with measured sound levels. The U. S. EPA published a model ordinance in 1975. An included survey identified 118 communities with local limits. The most popular limits for noise entering residential areas in daytime were 55 and 60 dBA with the average being 56.75 dBA. The most popular limits for night in residential areas were 50, 45, and 55 dBA in that order, averaging 51.75 dBA. The survey did not clearly identify how these sound levels were to be measured.
In the 1970’s, instruments became available to directly measure average sound levels over a period, but were initially expensive. The term “maximum sound level” came to mean the maximum instantaneous sound level with a fast or slow response. It was recognized that the limits at 60 dBA or below were inappropriate for an instantaneous maximum sound level but appropriate for an average level measured over a reasonable period. Such an average-level limit could automatically account for sound above the nominal limit for short times. Some communities not wanting to invest in the instruments that could measure average levels adopted a method based on the 10 percentile level, L10, combined with a higher instantaneous maximum level. For instance, the daytime limit for residential areas might be an L10 of 60 dBA based on 100 readings 10 seconds apart, with an instantaneous slow maximum limit of 70 dBA. Unfortunately, many communities never adopted any averaging or sampling methodology and interpret the limits at 60 dBA and below as instantaneous maximum levels. This is unreasonably restrictive. More recently, communities recognizing this have raised the limits to 70 dBA day and night, but still without any lower limit for continuous sound. This creates a situation where steady sound approaching 70 dBA could occur, a very unacceptable situation in a residential area. Such would create a day-night sound level exceeding DNL 75 dBA, totally unacceptable by the HUD criteria.
The limits also must consider existing accepted sounds and variations in noise expectations within the overall geographic area covered. The limits must not be too restrictive for more densely populated areas that normally have and expect more noise or so high that they provide no protection to quieter areas that expect quiet. Separate limits may be required for different geographic areas of a jurisdiction.
Ordinances commonly divide properties into three categories: residential, business or commercial, and industrial. Care must be used to define exactly how boundary situations are treated since most serious noise issues occur when business or industrial uses are near residential uses. Ordinance limits are usually related to the sound reaching or entering a property and the actual use or zoning of the property the sound is entering, with lower limits for residential areas than commercial or industrial areas. Sometimes limits are inappropriately based solely on the use or zoning of the source property. This can result in situations where industrial properties next to residences are allowed to put sound onto the residential property that is unacceptable for residential use. In some communities there is a compromise in which the limits consider the use of both the source and receiving properties. Some communities base limits on actual use of a property regardless of zoning, while in other communities, everything is based on zoning of the property regardless of actual use. There are advantages and disadvantages to each. When only “actual use” is recognized, owners of properties next to business or industrial properties can find themselves limited to lower sound levels if a residence is established on such business or industrially zoned property. When only “zoning” is recognized, homeowners can be surprised to find that their home is not zoned residential and thus neighbors are allowed to put higher levels of sound onto them. For instance, in Raleigh some large residential communities are developed in areas zoned “thoroughfare” that carry the same noise limits as industrial areas.
Ordinances may be zoning performance standards for new sources that “grandfather” existing sources or general ordinances enforced against any source. Zoning performance standards will more commonly include octave band limits and can be more stringent than general ordinances to limit the growth of noise. General ordinances usually are kept simple and based on measurements over periods typically less than an hour. They cannot be a full assessment of the long-term noise environment.
Most ordinances are unfortunately very poorly written and confusing. They often leave out very important information making them impossible to interpret or enforce. Among the common mistakes and problems found are the following.
- Use of old octave bands. Some communities continue to adopt ordinances based on the 1955 Chicago ordinance limits. These were in octave-bands, but based on an earlier standard that was changed the early 1960’s. No instrument made since 1963 can measure in the way specified.
- Failure to specify the appropriate “fast” or “slow” time constants for instantaneous or observed meter measurements, or an averaging time for average level measurements.
- Failure to specify clearly the limit that applies when the “use” category of the source and complainant differ.
- Using limits developed as appropriate for a receiving land use but applying them based solely on the source land use.
- Specifying the same limit for all property uses, either too high for residences or too low for business and industrial areas.
- Specifying the same sound level limit day and night.
- Specifying limits appropriate for continuous sounds without any options for higher levels for brief events, meaning that brief events that are not a problem become violations.
- Specifying limits appropriate for the maximum level of brief events without any lower limit for continuous sounds, meaning that continuous sounds are allowed at unacceptably high levels.
- Specifying night-time limits so low that everyone’s air-conditioning condenser is in violation.
- Specifying higher limits for every Friday and Saturday evening without any permits required meaning that some people may never be able to enjoy a quiet weekend evening.
- Failing to recognize that some sounds that contain information content and are designed to get attention (music, speech, siren-like sounds from some mechanical equipment, impulsive sounds like gunshots, dog barks) are more intrusive and disruptive than random noises and thus can justify lower limits.
Almost all ordinances have one or more of these shortcomings. In some cases the problems are so severe that the ordinance simply cannot be interpreted.
The information in this document is not provided as a consulting service or as a solution to any specific problem.